

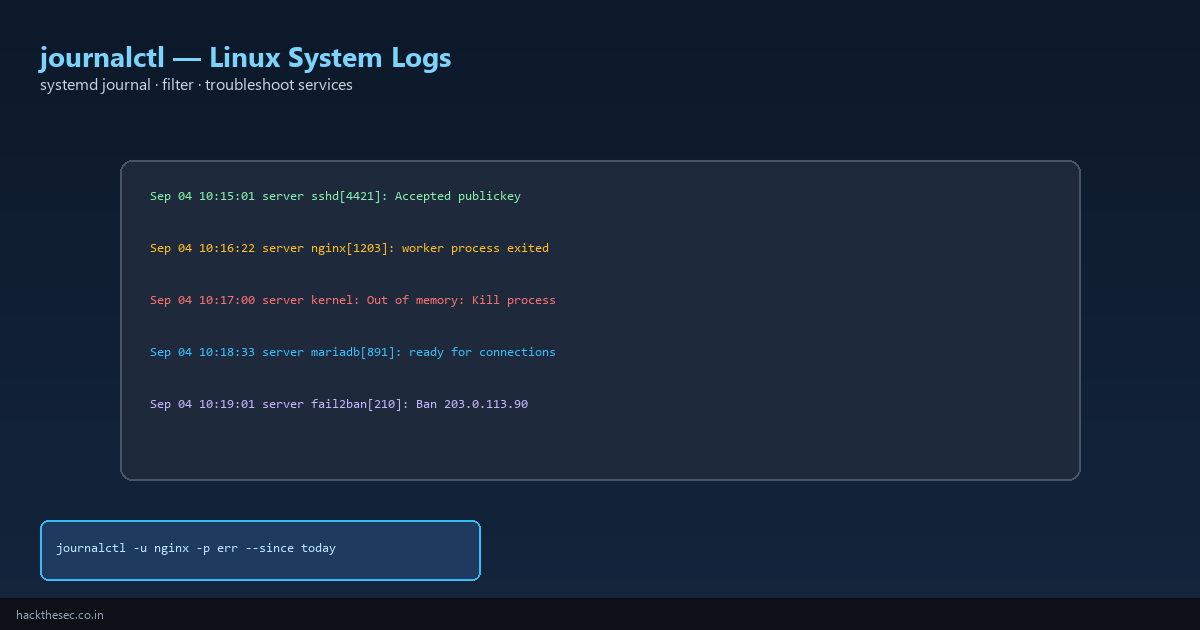
When a Linux service crashes, fails to start, or behaves oddly, the answer is almost always in the logs. On modern distros (Ubuntu 16.04+, RHEL 7+, Debian 8+, AlmaLinux), systemd's journal is the primary log store — and journalctl is your tool to read it.
This guide teaches everything a sysadmin needs: read logs by service, filter by time and priority, follow live output, investigate boot failures, and manage journal disk usage.
Time required: 30–40 minutes. Applies to: any systemd-based Linux.
Table of contents
- journalctl vs /var/log files
- Basic commands every admin needs
- Filter by systemd unit (service)
- Filter by time range
- Filter by priority (errors and above)
- Follow logs live (like tail -f)
- Investigate boot and startup failures
- Export and share logs
- Journal storage and disk limits
- Common troubleshooting scenarios
1. journalctl vs /var/log
| Source | Contains | Tool |
|---|---|---|
| journal (binary) | All systemd service stdout/stderr, kernel, auth | journalctl |
| /var/log/*.log | Legacy text logs (nginx, apache, auth.log) | tail, grep |
Many services log to both. Start with journalctl for systemd-managed services (nginx, mariadb, sshd, docker, fail2ban).
2. Basic commands
# All logs, oldest first (pager opens — q to quit)
journalctl

# Last 50 lines, newest first (most common)
journalctl -n 50 --no-pager

# Today's logs only
journalctl --since today

# Current boot only
journalctl -b

# Previous boot (after a crash/reboot)
journalctl -b -1
3. Filter by service (unit)
# SSH daemon
journalctl -u sshd -n 100

# Nginx
journalctl -u nginx --since "2 hours ago"

# MariaDB / MySQL
journalctl -u mariadb -f

# Docker
journalctl -u docker --since yesterday

# Find unit name if unsure
systemctl list-units --type=service --state=failed
4. Filter by time
journalctl --since "2026-09-04 08:00:00"
journalctl --since "1 hour ago"
journalctl --since yesterday --until today
journalctl --since "2026-09-01" --until "2026-09-04 12:00"

# Combine with unit
journalctl -u fail2ban --since "24 hours ago" --no-pager
5. Filter by priority
Priorities: emerg(0), alert(1), crit(2), err(3), warning(4), notice(5), info(6), debug(7)
# Errors and above only
journalctl -p err -b

# Warnings and above for nginx
journalctl -u nginx -p warning --since today

# Kernel errors
journalctl -k -p err --since "1 week ago"
6. Follow live logs
# Follow all new journal entries
journalctl -f

# Follow one service
journalctl -u sshd -f

# Follow with grep filter
journalctl -u nginx -f | grep --line-buffered error
7. Boot and startup failures
# Why did the last boot take long?
systemd-analyze blame | head -20
systemd-analyze critical-chain

# Services that failed to start
systemctl --failed

# Logs from failed service
journalctl -u mariadb -b --no-pager | tail -50

# Logs from previous boot after crash
journalctl -b -1 -p err
8. Export logs
# Plain text export for support ticket
journalctl -u nginx --since today --no-pager > /tmp/nginx-today.log

# JSON output (for log parsers)
journalctl -u sshd -o json --since "1 hour ago" | head

# Full system journal bundle (large!)
sudo journalctl --no-pager > /tmp/full-journal.txt
9. Journal disk usage
# Check journal size on disk
journalctl --disk-usage

# Limit journal to 500 MB (persistent config)
sudo mkdir -p /etc/systemd/journald.conf.d/
sudo tee /etc/systemd/journald.conf.d/size.conf <<'EOF'
[Journal]
SystemMaxUse=500M
MaxRetentionSec=2week
EOF
sudo systemctl restart systemd-journald

# Vacuum old entries now
sudo journalctl --vacuum-size=200M
sudo journalctl --vacuum-time=7d
10. Common scenarios
- SSH login failures:
journalctl -u sshd | grep -i 'failed\|invalid' - Out of memory kills:
journalctl -k | grep -i 'out of memory' - Service won't start:
systemctl status SERVICENAMEthenjournalctl -u SERVICENAME -b --no-pager - Disk full:
journalctl --disk-usage— journal can grow large on busy servers - After package upgrade broke service: compare
journalctl -u APP -bvsjournalctl -u APP -b -1
Bottom line: journalctl -u SERVICE -n 100 is your first command when anything breaks. Combine unit, time, and priority filters to find the exact error line in seconds instead of scrolling megabytes of text.